
Page 11 - Orari Gorge 2021 Catalogue ebook
P. 11
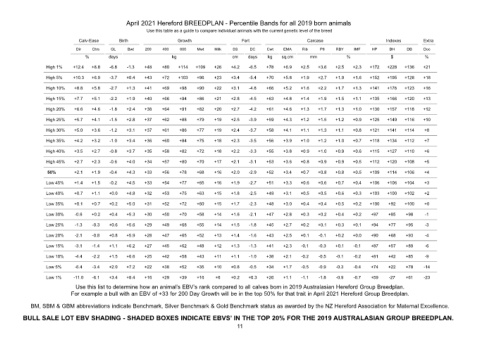
April 2021 Hereford BREEDPLAN - Percentile Bands for all 2019 born animals
                                     Use this table as a guide to compare individual animals with the current genetic level of the breed
                     Calv-Ease  Birth        Growth          Fert            Carcase             Indexes  Extra
                    Dir  Dtrs  GL  Bwt  200  400  600  Mwt  Milk  SS  DC  Cwt  EMA  Rib  P8  RBY  IMF  HP  BH  DB  Doc
                      %     days            kg             cm  days  kg  sq.cm  mm     %          $       %
            High 1%  +12.4  +8.8  -6.8  -1.3  +48  +80  +114  +109  +26  +4.2  -6.5  +78  +6.9  +2.5  +3.6  +2.5  +2.3  +172  +228  +136  +21
            High 5%  +10.3  +6.9  -3.7  +0.4  +43  +72  +103  +96  +23  +3.4  -5.4  +70  +5.8  +1.9  +2.7  +1.9  +1.6  +152  +195  +128  +18
            High 10%  +8.8  +5.8  -2.7  +1.3  +41  +69  +98  +90  +22  +3.1  -4.8  +66  +5.2  +1.6  +2.2  +1.7  +1.3  +141  +176  +123  +16
            High 15%  +7.7  +5.1  -2.2  +1.9  +40  +66  +94  +86  +21  +2.8  -4.5  +63  +4.8  +1.4  +1.9  +1.5  +1.1  +135  +166  +120  +13
            High 20%  +6.6  +4.6  -1.8  +2.4  +38  +64  +91  +82  +20  +2.7  -4.2  +61  +4.6  +1.3  +1.7  +1.3  +1.0  +130  +157  +118  +12
            High 25%  +5.7  +4.1  -1.5  +2.8  +37  +62  +88  +79  +19  +2.5  -3.9  +59  +4.3  +1.2  +1.5  +1.2  +0.9  +125  +149  +116  +10
            High 30%  +5.0  +3.6  -1.2  +3.1  +37  +61  +86  +77  +19  +2.4  -3.7  +58  +4.1  +1.1  +1.3  +1.1  +0.8  +121  +141  +114  +8
            High 35%  +4.2  +3.2  -1.0  +3.4  +36  +60  +84  +75  +18  +2.3  -3.5  +56  +3.9  +1.0  +1.2  +1.0  +0.7  +118  +134  +112  +7
            High 40%  +3.5  +2.7  -0.8  +3.7  +35  +58  +82  +72  +18  +2.2  -3.3  +55  +3.8  +0.9  +1.0  +0.9  +0.6  +115  +127  +110  +6
            High 45%  +2.7  +2.3  -0.6  +4.0  +34  +57  +80  +70  +17  +2.1  -3.1  +53  +3.6  +0.8  +0.9  +0.9  +0.5  +112  +120  +108  +5
             50%   +2.1  +1.9  -0.4  +4.3  +33  +56  +78  +68  +16  +2.0  -2.9  +52  +3.4  +0.7  +0.8  +0.8  +0.5  +109  +114  +106  +4
            Low 45%  +1.4  +1.5  -0.2  +4.5  +33  +54  +77  +65  +16  +1.9  -2.7  +51  +3.3  +0.6  +0.6  +0.7  +0.4  +106  +106  +104  +3
            Low 40%  +0.7  +1.1  +0.0  +4.8  +32  +53  +75  +63  +15  +1.8  -2.5  +49  +3.1  +0.5  +0.5  +0.6  +0.3  +103  +100  +102  +2
            Low 35%  +0.1  +0.7  +0.2  +5.0  +31  +52  +72  +60  +15  +1.7  -2.3  +48  +3.0  +0.4  +0.4  +0.5  +0.2  +100  +92  +100  +0
            Low 30%  -0.6  +0.2  +0.4  +5.3  +30  +50  +70  +58  +14  +1.6  -2.1  +47  +2.8  +0.3  +0.2  +0.4  +0.2  +97  +85  +98  -1
            Low 25%  -1.3  -0.3  +0.6  +5.6  +29  +49  +68  +55  +14  +1.5  -1.8  +45  +2.7  +0.2  +0.1  +0.3  +0.1  +94  +77  +95  -3
            Low 20%  -2.1  -0.8  +0.8  +5.9  +28  +47  +65  +52  +13  +1.4  -1.6  +43  +2.5  +0.1  -0.1  +0.2  +0.0  +90  +68  +93  -4
            Low 15%  -3.1  -1.4  +1.1  +6.2  +27  +45  +62  +48  +12  +1.3  -1.3  +41  +2.3  -0.1  -0.3  +0.1  -0.1  +87  +57  +89  -6
            Low 10%  -4.4  -2.2  +1.5  +6.6  +25  +42  +58  +43  +11  +1.1  -1.0  +38  +2.1  -0.2  -0.5  -0.1  -0.2  +81  +42  +85  -9
            Low 5%  -6.4  -3.4  +2.0  +7.2  +22  +38  +52  +35  +10  +0.8  -0.5  +34  +1.7  -0.5  -0.9  -0.3  -0.4  +74  +22  +78  -14
            Low 1%  -11.0  -6.1  +3.4  +8.4  +16  +29  +39  +16  +6  +0.2  +0.3  +26  +1.1  -1.1  -1.8  -0.9  -0.7  +59  -27  +61  -23
                    Use this list to determine how an animal’s EBV’s rank compared to all calves born in 2019 Australasian Hereford Group Breedplan.
                   For example a bull with an EBV of +33 for 200 Day Growth will be in the top 50% for that trait in April 2021 Hereford Group Breedplan.
         BM, SBM & GBM abbreviations indicate Benchmark, Silver Benchmark & Gold Benchmark status as awarded by the NZ Hereford Association for Maternal Excellence.
       BULL SALE LOT EBV SHADING - SHADED BOXES INDICATE EBVS’ IN THE TOP 20% FOR THE 2019 AUSTRALASIAN GROUP BREEDPLAN.
                                                            11