
Page 12 - Puke-Nui Angus Catalogue eBook.pdf
P. 12
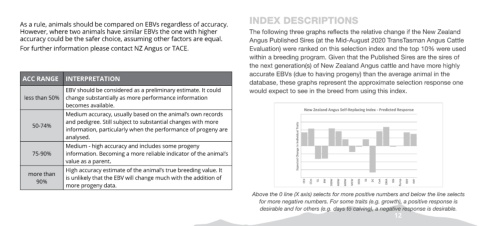
INDEX DESCRIPTIONS                                      Self Replacing Index (SRI)
      As a rule, animals should be compared on EBVs regardless of accuracy.
      However, where two animals have similar EBVs the one with higher   The following three graphs reflects the relative change if the New Zealand
      accuracy could be the safer choice, assuming other factors are equal.   Angus Published Sires (at the Mid-August 2020 TransTasman Angus Cattle   Genetic Selection of bulls using only the SRI tool will on average over
      For further information please contact NZ Angus or TACE.  Evaluation) were ranked on this selection index and the top 10% were used   time develop a cow herd with the following:
                                                               within a breeding program. Given that the Published Sires are the sires of   •  Improved weaning rate through increased fertility
                                                               the next generation(s) of New Zealand Angus cattle and have more highly   and easier calving
                                                               accurate EBVs (due to having progeny) than the average animal in the   •  A slowly decreasing cow size, milk and slowly increasing
       ACC RANGE  INTERPRETATION
                                                               database, these graphs represent the approximate selection response one   body condition
                 EBV should be considered as a preliminary estimate. It could   would expect to see in the breed from using this index.
       less than 50%  change substantially as more performance information                                             •  Progeny will be prime at a younger age for slaughter
                 becomes available.                                                                                    These characteristics are ideal for an environment where the herd is
                                                                            New Zealand Angus Self-Replacing Index - Predicted Response
                 Medium accuracy, usually based on the animal’s own records                                            exposed to prolonged seasonal feed deficits and feeding supplement
                 and pedigree. Still subject to substantial changes with more
         50-74%                                                                                                        is unlikely.
                 information, particularly when the performance of progeny are
                 analysed.
                 Medium - high accuracy and includes some progeny          Expected Change in Individual Traits
         75-90%  information. Becoming a more reliable indicator of the animal’s
                 value as a parent.
                 High accuracy estimate of the animal’s true breeding value. It
        more than   is unlikely that the EBV will change much with the addition of
          90%                                                                CEd  CEm  GL  BW  200W  400W  600W  MCW  Milk  SS  DC  Cwt  EMA  Rib  Rump  RBY  IMF
                 more progeny data.
                                                                Above the 0 line (X axis) selects for more positive numbers and below the line selects
                                                                 for more negative numbers. For some traits (e.g. growth), a positive response is
                                                                 desirable and for others (e.g. days to calving), a negative response is desirable.
                                                                                                   12